Are there any graphical diagrams like Freytag's Pyramid that help you keep track of different timelines, universe and dimensions? Sometimes a franchise has a timeline like Zelda, but what if you add in different universe and dimensions? How do you detail them all in a single graphical diagram?
1 Answer
Here's a brief overview of a survey of diagrams I've found, part of an ongoing research project on this topic:
1 - Gustav Freytag (1816-1895)
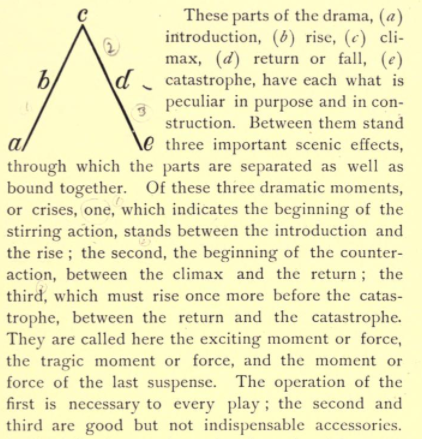
In Die Technik des Dramas (1836), translated into English by Elias MacEwan as Freytag's Technique of the Drama (1895) Freytag specifically analyses theatrical tragedies (he gives classical and Shakespearean examples) as having a 5-act structure rising to a climax and moving towards a resolution of some kind. He maps it as a 'pyramidal structure', helpfully annotated in this copy:
2 - Kurt Vonnegut (1922-2007)
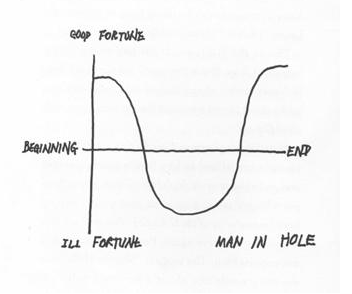
Both in his book, A Man Without a Country and live, Vonnegut uses line graphs to map events on X and Y axes, the Y axis mapping to 'good/bad fortune' and the X axis mapping the story from what the text has as 'beginning to entropy' and the graphic has as 'beginning to end':
3 - Robert McKee (1941-)
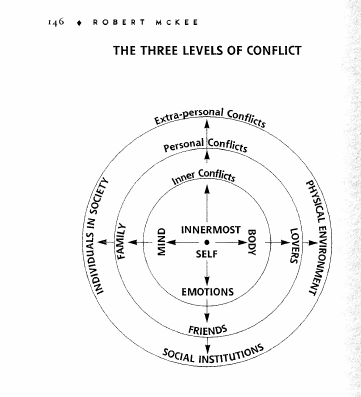
In his book, Story: Substance, Structure, Style, and the Principles of Screenwriting, McKee gives a number of diagrams, some showing relations between characters and situations using concentric circles:
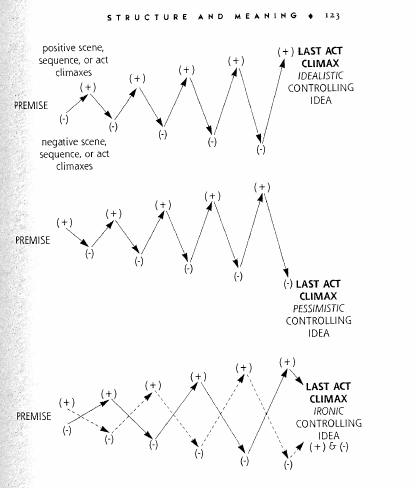
Others are similar to Vonnegut's and map different aspects of a story through a narrative:
4 - Janet Burroway (1936-)
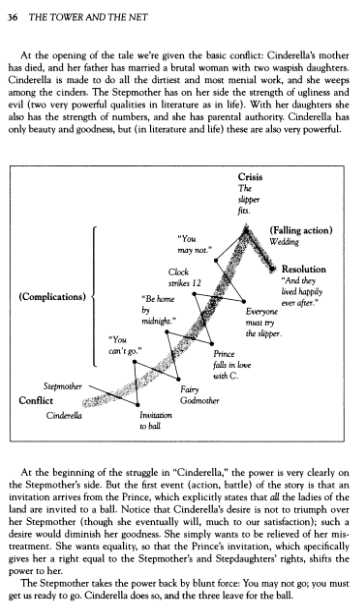
In Writing Fiction: A Guide to Narrative Craft, Burroway presents a mix of both Freytag's 'arc shape' and Vonnegut and McKee's 'wave' approaches to map one version of the tale of Cinderella as a generic structure:
The problem with these approaches, as you may have found when working on a complex story of your own, is that they attempt to plot the narrative arc without differentiating between the level of story (in which the events unfold in chronological order) and the level of plot (which unfolds according to how the events are told, which can be different). Writers need to be able to trace both.
Moreover, different characters' story lines each can follow very different patterns, something that isn't differentiated in the above graphs, which just plot a very, very generalised overview, which is useful, but it isn't enough if you are a writer and want to see both the detail and the overview at a glance.
I have a number of videos up on line and a book in the process of publication which offer a way of plotting a story using 6 very simple symbols that takes into account both the need for seeing what happens on the level of an individual character's story line, and allows these to be aggregated so the arc of the composite story can be viewed.
It would be pretty simple to map the relationships in time and space between different dimensions using this system. What's key here is that the patterns can be compressed and be related to common story structures, each with its own quality - providing an insight which complements and builds on the works of the popular authors quoted and that of more academic writers such as Propp, Levi-Strauss, Greimas and others.
It would be useful to know how well you think this approach could work for you potentially.

